What really matters in investing- a practical guide
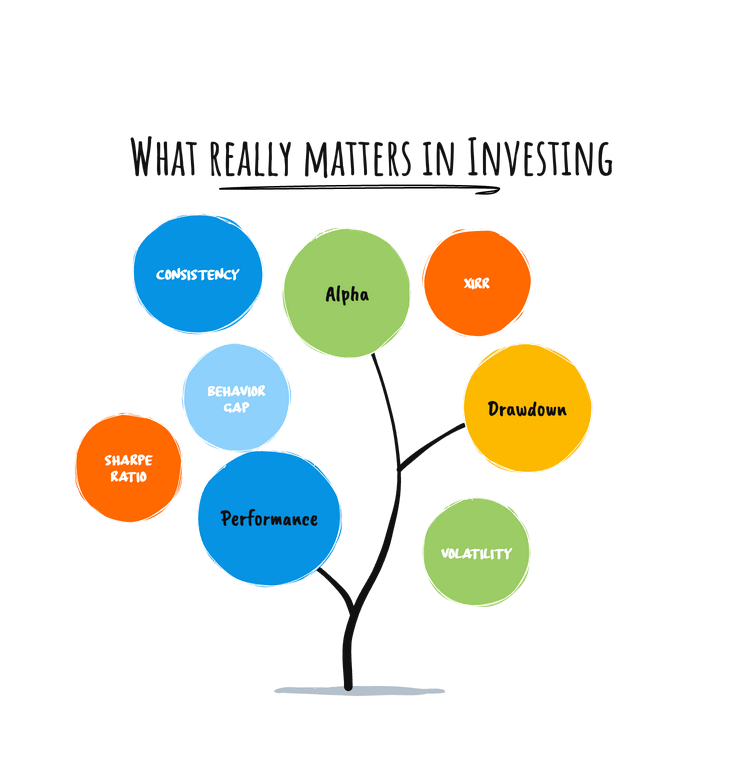
We hear a lot of jargon in finance—outperformance, alpha, drawdown, Sharpe, XIRR, volatility—but what really matters to an investor trying to compound wealth over time?

We hear a lot of jargon in finance—outperformance, alpha, drawdown, Sharpe, XIRR, volatility—but what really matters to an investor trying to compound wealth over time?
Let’s skip the theory and cut straight to what actually impacts your outcomes.
Here are 8 core concepts, explained simply with real-world relevance:
𝟭. 𝗢𝘂𝘁𝗽𝗲𝗿𝗳𝗼𝗿𝗺𝗮𝗻𝗰𝗲 — 𝗖𝗼𝗺𝗽𝗮𝗿𝗲𝗱 𝘁𝗼 𝗪𝗵𝗮𝘁?
"Outperformance" is meaningless unless you define the benchmark.
Beating Nifty 50? Good.
Beating post-tax FD returns after fees? Better.
Beating your own financial goals? Best.
𝟮. 𝗔𝗹𝗽𝗵𝗮 — 𝗦𝗸𝗶𝗹𝗹 𝗼𝗿 𝗝𝘂𝘀𝘁 𝗠𝗼𝗿𝗲 𝗥𝗶𝘀𝗸?
Alpha is supposed to mean outperformance due to skill—not luck or leverage. If your fund beats the index by 3%, but also took twice the risk, is it really alpha?
Example:
Fund return = 20%
Benchmark return = 10%
Beta = 1.2
Risk-free rate = 5%
Expected return using CAPM:
= 5% + 1.2 × (10% – 5%) = 11%
Alpha = 20% (Actual) – 11% (Expected) = 9%
𝟯. 𝗫𝗜𝗥𝗥 𝘃𝘀 𝗧𝗪𝗥𝗥 — 𝗞𝗻𝗼𝘄 𝗪𝗵𝗮𝘁 𝗬𝗼𝘂’𝗿𝗲 𝗟𝗼𝗼𝗸𝗶𝗻𝗴 𝗔𝘁
XIRR = your personal return, factoring your cash flows.
TWRR (Time-Weighted Rate of Return) = manager's skill, removes timing effects.
Illustration: How XIRR and TWRR Differ
Scenario:
Jan 1: You invest ₹5L
July 1: You add ₹5L more (when markets are high)
Dec 31: Portfolio is worth ₹10.8L
XIRR = 10.6% (your actual experience, affected by when you added money)
TWRR = 16% (reflects manager's skill, unaffected by timing)
(1 + 0.10) * (1 + 0.0545) - 1 = 1.16 - 1 = 16%
✅ Why TWRR Matters (and When XIRR Misleads)
TWRR removes the effect of cash flows, making it the fairest way to compare a fund manager’s performance to a benchmark.
XIRR reflects your actual return, which may be disproportionately impacted by emotional or poorly timed cash flow decisions.
𝟰. 𝗗𝗿𝗮𝘄𝗱𝗼𝘄𝗻 — 𝗧𝗵𝗲 𝗚𝘂𝘁 𝗖𝗵𝗲𝗰𝗸 𝗠𝗲𝘁𝗿𝗶𝗰
Drawdown is the maximum fall from a portfolio peak. Two funds may deliver 15% CAGR—but one fell 30% en route, the other only 10%.
𝟱. 𝗩𝗼𝗹𝗮𝘁𝗶𝗹𝗶𝘁𝘆 — 𝗥𝗶𝘀𝗸 𝗼𝗿 𝗝𝘂𝘀𝘁 𝗠𝗼𝘃𝗲𝗺𝗲𝗻𝘁?
Volatility is how much returns fluctuate. High volatility can be just noise, not true risk. Some low-volatility products may hide real risks—like concentration or liquidity issues.
𝟲. 𝗦𝗵𝗮𝗿𝗽𝗲 𝗥𝗮𝘁𝗶𝗼 — 𝗥𝗲𝘁𝘂𝗿𝗻 𝗽𝗲𝗿 𝗨𝗻𝗶𝘁 𝗼𝗳 𝗣𝗮𝗶𝗻
Sharpe = (Return – Risk-Free Rate) / Volatility
It tells you how efficiently you're being rewarded for risk.
𝟳. 𝗕𝗲𝗵𝗮𝘃𝗶𝗼𝗿 𝗚𝗮𝗽 — 𝗧𝗵𝗲 𝗕𝗶𝗴𝗴𝗲𝘀𝘁 𝗗𝗿𝗮𝗴 𝗼𝗻 𝗥𝗲𝘁𝘂𝗿𝗻𝘀
Dalbar studies show: investors consistently underperform the funds they invest in—due to poor timing, fear, and greed.
𝟴. 𝗖𝗼𝗻𝘀𝗶𝘀𝘁𝗲𝗻𝗰𝘆 — 𝗧𝗵𝗲 𝗛𝗶𝗱𝗱𝗲𝗻 𝗦𝘂𝗽𝗲𝗿𝗽𝗼𝘄𝗲𝗿
Jumping strategies, timing markets, chasing hot tips—all common, all harmful. Steady discipline wins.
These are the metrics, mental models, and mindset shifts that actually matter not just when you are doing it yourself but in selecting your advisor.
"In investing, what is comfortable is rarely profitable." – Robert Arnott
If you're building long-term wealth, start here. Read about the difference.


